ARIMA (Autoregressive Integrated Moving Average) is a statistical analysis model that uses time series data to understand and predict future trends. If you want to learn how to interpret ARIMA results, read this article.
Understanding ARIMA Results
In order to interpret the results, you need to know if:
- the model meets the assumptions using Jlung-Box chi-square statistics and autocorrelation of residuals
- each term is significant using p-values
- your model fits well using mean-squared error
In this article, as an example, we will review the results of a simple AR model trying to predict Bitcoin’s future results.
Review General Information
First things first, you need to review the general information.
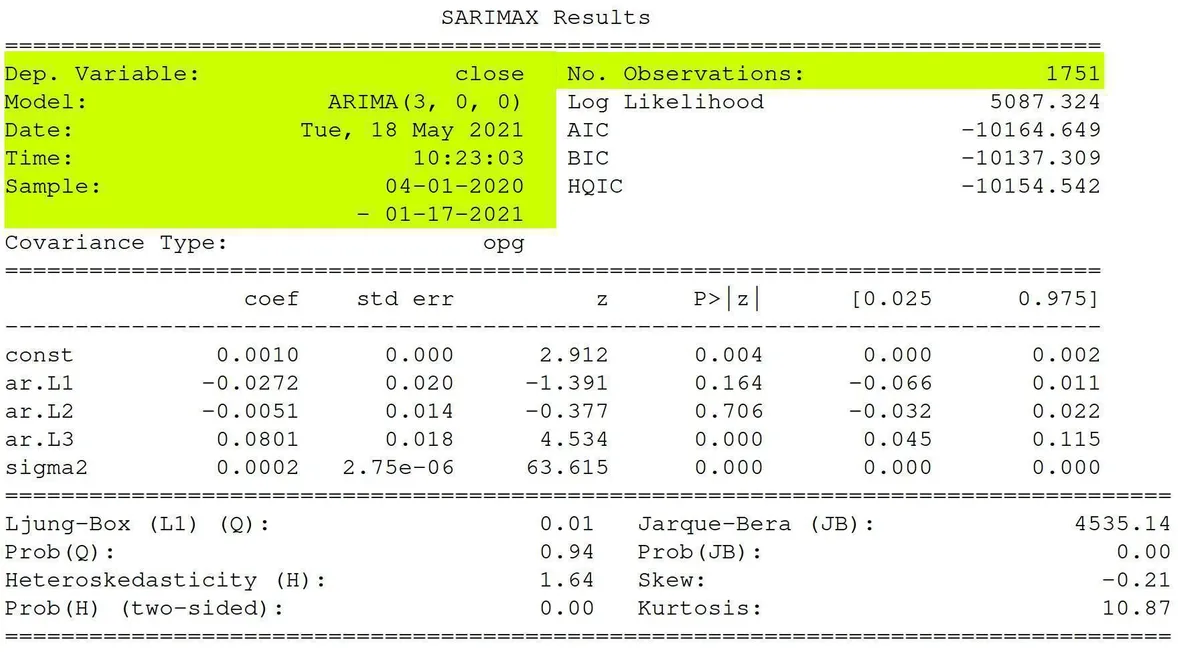
Here is some basic information:
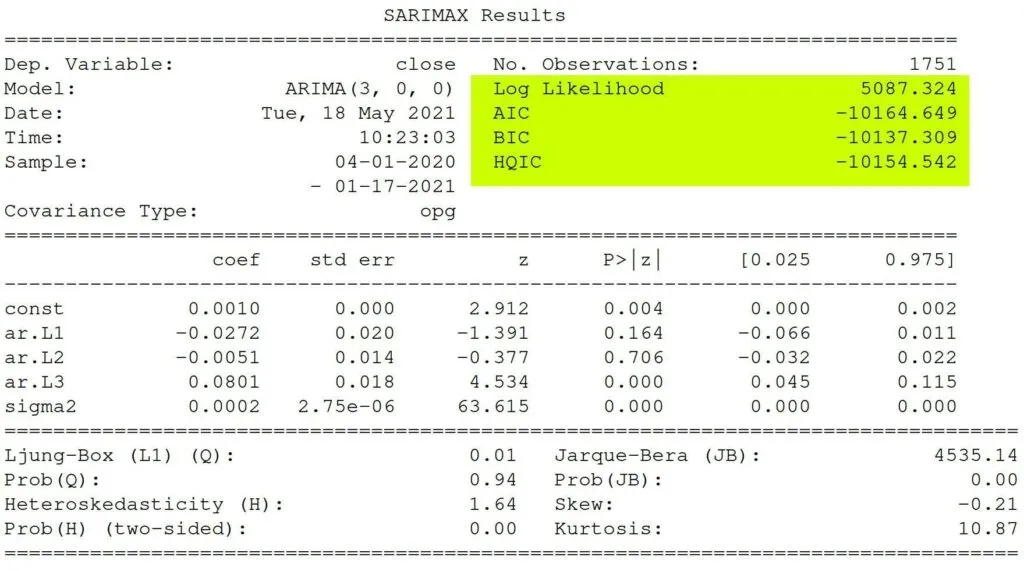
- SARIMAX – Seasonal AutoRegressive Integrated Moving Average with eXogenous regressors
- Dep. Variable – What we’re trying to predict.
- Model – The type of model we’re using. AR, MA, ARIMA.
- Date – The date we ran the model
- Time – The time the model finished
- Sample – The range of the data
- No. Observations – The number of observations
Note: The dependent variable is the close we’re trying to predict. The independent variables are the constant beta. The error term is sigma2 or epsilon in our equation above. Our lag variables are ar.L1, ar.L2, and ar.L3.
Determine Significance
Next, you need to make sure that the model is statistically significant.
The null means NOT statistically significant. So, each term should have a p-value of less than 0.05, so we can reject the null hypothesis with statistically significant values.
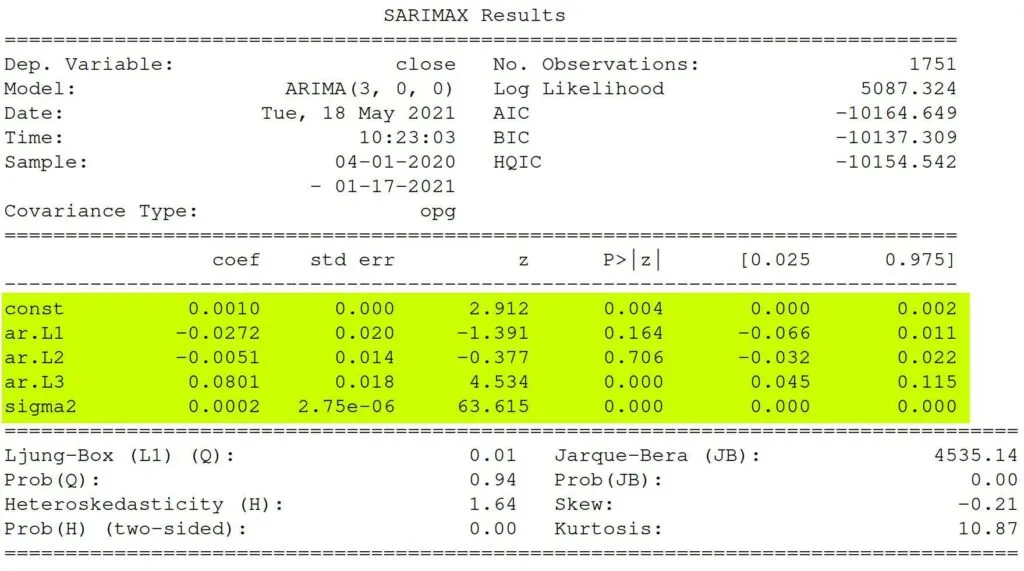
Based on the data, Ll and L2 are not statistically significant as their p-values are above the 0.05 threshold.
Review Assumptions
It is not time to check and review if our model meets the assumptions – that the residuals are independent. If the residuals are not independent, we can extract the non-randomness to make a better model.
Ljung-Box Test
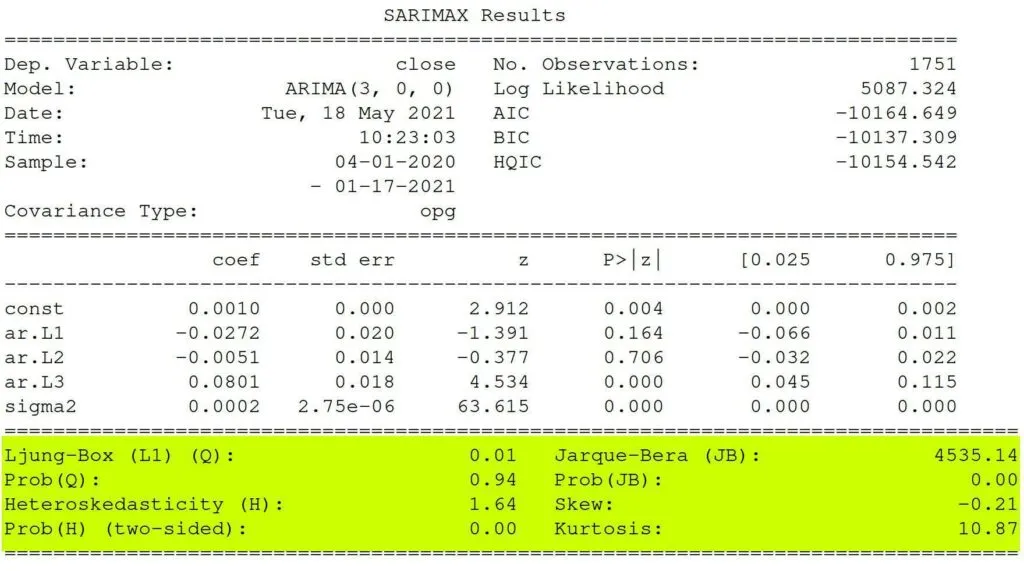
Pronounced “Young,” the Ljung-Box test checks that the errors are white noise
The Ljung-Box (L1) (Q) is the LBQ test statistic at lag 1 is, the Prob(Q) is 0.01, and the p-value is 0.94. Since the probability is above 0.05, we can’t reject the null that the errors are white noise.
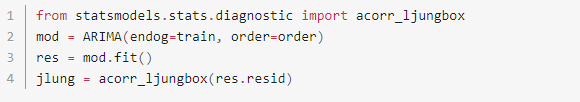
You can use a Ljung-Box diagnostic function to see all the statistics and p-values for the lags. Here’s how:
Heteroscedasticity Test
This method checks whether the error residuals are homoscedastic or have the same variance. The summary performs White’s test.
The summary shows a test statistic of 1.64 and a p-value of 0.00, which means we reject the null hypothesis and our residuals show variance.
Jarque-Bera Test
Jarque-Bera tests for the normality of errors. It checks if null that the data is normally distributed against an alternative of another distribution.
In our stats, we have a test statistic of 4535.14 with a probability of 0, which means we reject the null hypothesis, and the data is not normally distributed.
Fit Analysis
The Log-Likelihood, AIC (Akaike’s Information Criterion), BIC (Bayesian Information Criterion), and HQIC (Hannan-Quinn Information Criterion) help compare one model with another.
Check this data:
Log-Likelihood – It identifies a distribution that fits best with the sampled data.
AIC (Akaike’s Information Criterion) – It helps determine the strength of the linear regression model and penalizes a model for adding parameters.
BIC (Bayesian Information Criterion) – Like AIC, it punishes a model for complexity but also incorporates the number of rows in the data.
HQIC (Hannan-Quinn Information Criterion) – Like BIC and AIC, it is another criterion for model selection, but it is not used as frequently in practice.
want to learn how to algo trade so you can remove all emotions from trading and automate it 100%? click below to join the free discord and then join the bootcamp to get started today.