
What is Pine Script?
Pine script, created and designed by Trading View, is a programming language intended to write indicators and backtest trading strategies using Pine Script, its own language of the script. The main purpose is to maintain the edge and be an advantage over investors.
It was designed to have codes that are lightweight, which means that with fewer codes and lines, objectives can be achieved.
Although Pine Script is a type that is domain-specific and not based on a particular language. However, for those who use Python, you will notice the similarities quickly.
Why use Pine Script?
- Built-in Data
One of the reasons for using Pine Script is because of its big built-in data.
Using Pine Script involves sourcing your own data, and it means finding a place where to grab those data. Moreover, to do that, the data has to be formatted in a specific way. All these processes are definitely going to consume time.
- Easy to Use
Compare to other programming languages, Pine script syntax is easy-to-read and simple to understand. Most of the error-checking is done by the Trading View.
- User base and libraries are extensive
Users of TradingView may also publish their strategies and indicators to the library. There are other libraries and codes already written in the program that you can use and learn from.

Why Not Use Pine Script?
Pine script also has its limitation that may affect the users.
Here are some of those limitations:
- Data
Not all data can be found in TradingView. Although TradingView’s database is comprehensive, price data may still be unavailable if the trading strategy involves an obscure market.
Some data, like Quandl data, are still limited at this time. It is easier to use other programming languages than Pine Script due to flexibility and availability.
- External libraries
Pine script is not your best option if you want to leverage external libraries and do Machine learning. Other alternative programming languages are better, especially if the strategy relies on third-party libraries and data science.

Other Alternatives to using Pine Script?
- TD Ameritrade’s thinkorswim
Similar to Pine Script, this program uses “thinkScript” and it stores data on prices like how it is done in Pine Script. Also, thinkScript has built-in data and its platform is designed to allow users to customize strategies and indicators.
- Ninjatrader
The proprietary language that Ninjatrader uses is Ninjascript, but it is only partially proprietary because the language is based on C#. To those who are using C#, C, and C++ language, this alternative is a good choice.
Getting started with Pine Script
It is so simple and easy to get started with Pine script. You don’t need to download any file or application, and there is no need to install it.
To start with Pine Script, you need to have an account with TradingView through this link www.tradingview.com. At the upper right corner of the page, you will find the sign-in bar. You can use the traditional sign-up method using your email address and password or go for the one-click option.
If an account is already existing, simply log in and open the site.
An account in TradingView gives access to the cloud where scripts can be saved. It also allows you to customize the chart indicators.


Clicking the chart menu launches the charting platform. Another way to do that is to navigate to www.tradingview.com/chart.
A Glace at Pine Editor
The Pine editor is the place where coding and scripts are created. You can locate it at the bottom of the page.
Different from the Pine script, which is designed to create indicators or strategies.

On your screen, you will see the default script for creating an indicator. Notice how it is run from line to line.

In the first line, the two forward slashes start the comment line.
In the second line for the comment, the line comes with the user name.
The fourth line, which is also a comment line, is different because it contains the Pine Script version you prefer to use. This line is called the compiler directive.
In creating the scripts, the lines for the comments may not be required, but the line for the compiler directive or the version of the Pine Script is always required.
On the fifth line is where the creation of an indicator is declared. The goal is to create a strategy and this line begins with a line for an indicator. It also contains quoted “My Script” with a quotation mark to declare the assignment of a particular indicator.
Line 6, the line contains the specific plot command, informing the TradingView that the desire is to plot a specific “close” variable.
The plot “close” variable line is about the closing price. It tells that you want to know the price at closing.
After line 6, click “Add to Chart” located on the upper right side of the page.

The screen will prompt you to save the created script.

After saving the script, a new window shows the chart containing the closing prices. This is the data window and it is shown in the image in blue color.
Retrieving the price of Apple
The plotted closing price in the first example is shown in the images, together with the steps. This is actually done in a Pine script automatically in any chart you open.
The example provided shows that a chart of Bitcoin is opened.
If you want to open another asset because you want to get its data, for example, the price of Apple, you can always do that in Pine Script.
The start of every script is always a line that contains the compiler directive or the version of Pine Script to be used. This is followed by the indicator or strategy and the quoted variable or name that you want to create.

The indicator for this example is the “price of Apple”.
To inform Pine Script that you want to open another asset aside from the one that is currently opened and shown on the chart, you need to use a request function.
The command for this is “request.security()”.
In case you haven’t worked with the same syntax before, there is nothing to worry about. Pine script has this special feature that allows users to access readily available help anytime.
To give you an example, hover over a function. Then it will give you a brief description of that function.

You can also launch and open a help window if you want to get detailed information. On a personal computer, this is done by pressing CTRL or the control key and clicking the function. On a Mac device, this is done by pressing CMD and clicking the function.

Using this function makes the syntax appear clearer and with more clarity.
The example shown in the image above is a code snippet that used syntax. The ticker symbol AAPL in the security function is the first value. It is followed by a “D”, which tells that you want the daily time frame. Then the function “close” indicates the Pine Script that you want the data of the closing price.
Now it’s time to save it to a variable as shown in the image.
The variable is the “apple_price” and it contains the latest data on the daily closing price of Apple’s stock.
In Pine script, those created studies should have an output, at least one, otherwise, the created script generates an error.
To see the result, plot your variable in such a way that satisfies the rule in Pine script.
The image below shows the chart of the price of the apple.
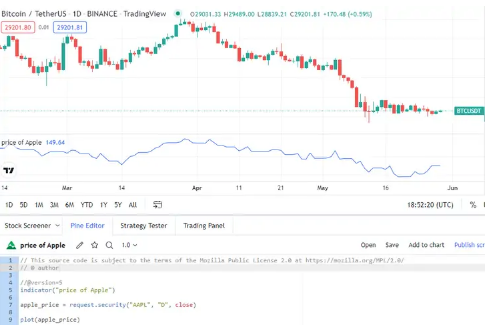
You now have the data of the daily closing price of Apple in one window, and at the same time, the main window shows you a chart of Bitcoin.
Here is the full code:

Retrieving the SMA(20) of Apple
A Simple moving average or SMA can be retrieved using the same process.
To begin with, you will be using the basic declarations and the security functions similar to the one you created in the last script.

If the 20 SMA is not the data you want to get specifically for AAPL, you can simply use the built-in variable “close” and skip the security definition.
The helper function is also available for the SMA indicator, and it is built-in into the Pine script. The function for this is “ta.sma() function”.
The price value is the first parameter to pass in. To do this, you are going to use the “apple_price” variable, which is the variable for Apple’s closing price.
This is followed by the 20-period SMA, which is the length of the SMA.
The last step is to assign and plot the SMA data with a separate variable.

You will now see the SMA for Apple plotted in the data window.

Typically, these moving averages are plotted on the chart. With slight modifications in the code, this can be achieved all the time.
The data can also be plotted directly in the main chart by simply adding into the indicator declaration the script “overlay=True”.

Here is the full Code:

Backtesting a moving average cross-over strategy with Pine Script
Now that you are done with indicators, it’s time to look at strategies and how they are done in Pine Script.
The next move is to create a moving average cross-over strategy using additional parameters. In the given example, you will do a backtesting of the strategy within TradingView.

In creating a strategy, all you need to do is to swap the indicator declaration out with the strategy declaration.

The initial goal is for the two moving averages to be created, and then the data is assigned to variables.
To confirm the entries and exits, you will then create an RSI indicator.
Since the created strategy is going to run right on the main chart, there is no need to use a security function ().
After creating the strategy, you will then specify the crossover conditions. The good thing with TradingView is that it already has a built-in function, which means that there is a need to code it.

In doing the crossover, there are two conditions to consider. The first condition is when a short 10-period SMA crosses over a longer SMA.
The second condition has the crossunder function opposite to the crossover function.
Because these two conditions are already saved to the variables, the variable will automatically get updated when a crossover or a crossunder occurs.
In case the condition changes to True, an “if” statement will be used. A trade will be executed when that happens.

Moreover, to enter trades, you will then use the built-in “strategy.entry” function.
Check these parameters and entries passed as a function:
1. “long” – this entry is a trade ID. This is used to close or cancel any trade.
2. “strategy.long” – this entry is one of the built-in variables. It is used to inform Pine script of the intention to go long.
3. “100” – this entry is for the number of shares intended to trade
4. “when = rsi > 50” – this entry is another parameter telling Pine script to a execute trade only if the RSI is greater or higher than 50.
The same format is used in the syntax for short entries.

As explained above, when running a strategy, there is no need to plot or specify.
However, the plotting is executed in this example, and it is intended to get a look and see the SMA placed on the chart confirming the trade.

A click to “save” and “add to chart” makes the strategy run and open automatically. The Strategy Tester window opens and displays some of the most important stats.
The image below shows how the screen displays.

A new tab opens by default, and it shows the overview stats. The list of other statistics is shown in the List of Trades or Performance Summary.
The strategy runs based on the time frame displayed in the chart.
Meanwhile, the time frame options that you can see in the menu are used to cycle the different time frames.
Check the full code here:

Setting specific take profits and stop losses
In the previous examples, you learned about how to determine trade executions by moving average crossovers, and also the crossunders.
As you build on this script, you can use the Average True Range or ATR for the calculation of its level. You will also set up take profits and specific stop losses.
In the previous example, you have seen several indicators and how they are declared. Now it’s time to add to the list the ATR indicator.

In this example, you can see that the calculations for stop loss and take profit are made under the trade conditions.

As shown in the code above for the entry, stop loss is calculated by subtracting ATR multiplied by 2 from the low of the bar.
For example, if the stock moves on an average of $5 per bar, then the setting for stop loss is $5 x 2 = $10, below the low.
For take profit, you can see a similar calculation.
For the exit, you will specify the exit condition by using a specific function, the “strategy.exit()” function. Check these parameters:
1. “exit” – this function is the trade ID. It is used to exit from the trade.
2. “long” – this function is the ID used for the entry. It informs the Pine script about the position you are exiting from.
3. “stop=stopLoss” – This function specifies the stopLoss variable being used to exit the trade.
4. “limit=takeProfit” – this function specifies the takeProfit variable being used as a limit order as it exits the trade.
The syntax may appear similar for the short condition but there are some slight differences in the calculations.

In the image shown above, you can see that the rest of the script is the same as in the previous example. It’s time to run the script and see how the strategy went.

Notice how the exits are running as they are plotted in the chart, together with the long and short entries.
Check the full code here:

Firing a trade when Google moves 5%
This time you will use a security function to create a specific strategy. The function is meant to perform a trade if there is a 5% movement in Google.
This strategy is called mean reversion. It is used to short Apple if Google rallies at a rate higher than 5%. A Google fall of 5% higher is a sign to buy Apple.
To do this first is to store the daily opening and closing prices in variables.

Now you will then make a calculation that will determine the rate or percentage of the price change.
This variable “price_change” holds the calculation. For example, the price opens at $100 and closes at $105 with a rally of 5%. The variable of “price_change” based on the calculation is 105/100 or 1.05.
In case the opening is at $100 and the closing is $95 with a decline of 5%, the variable “price_chage” is 95/100 or 0.95.
The calculation explains that if there is a Google decline of 5% or higher, then the variable for the “price_change” is 0.95 or lower. In addition, if you intend it for a long strategy, this is the syntax for that.

Moreover, if you intend for a short strategy for a Google rallied at more than 5%, this is the syntax.

If you will notice, no price of Apple stock is mentioned in the code. In Pine script, it will automatically execute the trade in Apple once the AAPL chart is opened.
Now you will proceed to the last step., the plotting of the variable “price_chage” in the data window. Although there is no need to do it, for the sake of seeing the confirmation of the executed trades, you can still do it using this function.
The result of the strategy created is shown below.

See the full code here:

Modifying scripts without coding
As discussed above, Pine script comes with lots of cool features, and one of those is the ability to create and customize inputs that will change the parameters of the strategies and indicators.

In TradingView standard ATR indicator, you will notice that it is easy to change and modify the length and colors through the Style tab.
The same modification can be created in Pine script for the studies and strategies by using the function input().
Check this example showing the use of an input function that allows users to modify the change from the recent strategy.

These are the parameters for this input() function.
1. “title “– this function is used to specify the text that is intended for changing the value of a parameter.
2. “defval” – this function is for the default value.
Using these parameters, you can get values, but the input value is 5(%). It means that there is a need to convert the percentage 5% to 1.05 to serve the if statements.

The “if” statement has to be changed as well, and this is to see the new variables you created based on the input and not on the previous values.

The input options can be accessed by clicking the gear icon that is located next to the strategy name in the data window.
Now you can set the custom values for the percentage change.

To set the custom options for other strategies and their parts, there is the Properties window that you can utilize.

To customize the plotting options, the Style window is also available.

Here is the full code:

Plotting with Pine Script
The standard function to plot anything on the screen is the plot() function. Other commands in the Pine script are also available to use.
Plotting the Forex market hours
Forex traders should know how to figure out the hours of the markets or when they open and close.
In Forex trading, which operates 24 hours in 5 days per week, different markets open and close daily around the world, thus the impact on currency volatility.
In this example, an indicator is programmed to tell when the markets will be the busiest.
Since many Forex traders pay attention mostly to sessions in London and New York, the time for these sessions will be specified in the example.

You will notice that the time() function is used here in creating a period. For this example, the specific parameters for the London session starting time will be 0700 UTC, while for the ending time will be 1500 UTC.
The variable “London” will show the bar time if it falls between the specified period. It will show, on the other hand, a “NaN” (not a value) if not.
You can also use the “if” statement to check the variable “London” output.

The image above shows that the code used is a built-in function “na()”. It is used to check the variables whether they have a NaN value or not.
A “Nan” for the “London” variable means that the bar time falls outside the trading hours.
In the example above, the “val” variable is assigned to the integer 1. If not 1, the val variable is set at 0.
For the last step, a newly created “val” variable is created.
Save and add the indicator, and then the chart will look like this:

Based on the image of the output above, there seems to be wrong. The codes are not right, but the good thing is that they can still be fixed.
To clean the code, you will be using the “if” statement in one line only.
The code used above performs a similar function. This time the “val” variable will not be used.
The code above aims to check if the “London” variable has a NaN value.
The next code here has a question mark at the beginning of the entry and it is for the if/else statement.
The number 1 after the question mark, and the 0 separated by a colon state that if the statement is true, 1 returns. If the statement is false, 0 returns.
This is the code for the said plot:
The “if” statement is now clean and in one line.
You can change the background color to specify that the London market is open, making your chart clean and readable.
This is the code to change the background color.
Another code to specify that the market is open:
Notice how the chart becomes more comprehensive.

To add the data for the New York market, and to know if it is open, this is the code to add for the chart:
Now there are three colors displayed in the chart.

The three colors show that an overlap happens between the session times, the most volatile time, of London and New York.
Check the full code here:

Plotting Annotations
Plotting annotations is done in several ways. The “hline()” function, for example, is used to draw across the chart horizontally.
To plot a note or other ASCII characters on a chart, you will use the “plotchar()” function.
To plot various shapes, you will use the “plotshape()” function.Check this link https://www.tradingview.com/pine-script-docs/en/v4/annotations/index.html for the complete list of available annotations used in Pine script.
Customizing an indicator in Pine script
This time you will create an indicator in a multi-timeframe.
Bollinger Bands is used in this strategy for a 5-minute chart, as well as for the RSI on a 1-minute chart.

The image shown above displays the Asian Forex sessions. As you can see in the chart, the session in the first half is working as expected. The next half, however, shows a breakout risk or that there is an increase in the directional movement.
Normally, the user has to keep 2 charts to open a 1-minute chart and a 5-minute chart. But in the given example, the 5-minute chart is drawn from the 1-minute chart directly.

This indicator is created in the following way:

First, declare the name of the script and the indicator. A short title added to the code is the title on the chart.
Then you will set user inputs from the Bollinger bands, which you can duplicate to customize the indicator.

This time you will create an indicator for the Bollinger band from the built-in helper function.
In the image above, you can see that the returned values are the lower, the mid, and the upper band. These values are saved to variables individually.
To calculate these values in a different timeframe, you will then use the “security ()” function.

You will use “syminfo.tickerid” to avoid the ticker symbol in the same format.
The last step is to plot the indicator you created.

Check the full code here:

Conclusion
Pine script offers a variety of capabilities, and the examples provided above show some of them. Indeed, there are lots of things that you can achieve and perform in Pine script despite the limitations.
Moreover, TradingView can also take you to another level in Pine script coding through its many resources.
The help functions and help options are also available to make your coding task easier.
Other resources in TradingView:
1. Quickstart Guide
Your guide to basic coding from creating an indicator to breaking down the script line by line.
2. Pine Script v5 User Manual
A detailed manual
3. TradingView Blog
Provides content about sample codes and new features
4. TradingView Scripts Library
An open source for studies and strategies.
The libraries provide users and traders strategies and codes already published by other users.
want to learn how to algo trade so you can remove all emotions from trading and automate it 100%? click below to join the free discord and then join the bootcamp to get started today.